Ask a CFO which costs are rising, and you’ll hear cloud, compliance, and contractors. Ask a CHRO and you’ll hear the same – but with a twist: hidden hiring gaps inflate all three. Slow slates delay revenue capture, inconsistent screening leads to mis-hires, fairness breaches create exposure, and offer delays send top talent to competitors. The fix isn’t a bigger dashboard; it’s AI native benchmarks that tighten the process where it leaks value – and create an auditable trail your board will accept.This post maps the costliest hiring gaps we see in enterprise environments and the AI benchmarks that close them. You’ll get precise KPI formulas, target thresholds, and the design of an “evidence first” pipeline – plus a 90-day rollout plan your HR and Finance partners can co-own.
What we mean by “hiring gaps” (and why they’re expensive)
A hiring gap is a measurable break between intent (the role you need) and evidence (the data proving consistent, fair, high-quality decisions). Gaps are expensive because they show up as:
-
Revenue deferral: Projects start late when the Time to Qualified Slate (TTQS) drifts.
-
Productivity drag: Mis‑aligned hires increase ramp times and manager burden.
-
Risk & compliance exposure: Stage level disparities (e.g., AIR < 0.80) invite scrutiny.
-
Cost leakage: Over-reliance on agencies and ad spend when rediscovery is weak.
AI‑native benchmarks are targets backed by continuous, machine-captured evidence – stage timestamps, structured scorecards, model health, and fairness monitors – so Finance, Legal, and Audit can trace every number.
The six costliest enterprise hiring gaps – and the AI benchmarks to close them
Each gap below includes: a KPI, the Formula, the AI Benchmark (target), the Enterprise Fix, and the Evidence your teams should capture.
1) Slow start: Time to Qualified Slate (TTQS)
KPI & Formula: TTQS = date (first shortlist delivered) − date (finalized JD)
AI Benchmark: <= 7 calendar days for repeat roles; <= 14 days for netnew or niche roles.
Enterprise Fix: Structured JDs with outcome statements → skills parsing against a governed taxonomy → contextual matching that explains each recommendation (skills, recency, seniority) → multi-channel outreach (email/SMS/voice) to tap netnew + rediscovery pools.
Evidence: JD version history; taxonomy version; candidate feature rationales; outreach timestamps; shortlist precision measured against human acceptance.
2) Inconsistent evaluation: Screening variance and noisy signal
KPI & Formula: Structured Assessment Coverage = % of candidates evaluated using standardized, job-related rubrics/question banks.
AI Benchmark: >= 90% coverage by role family; inter-rater variance <= 0.5 SD on critical competencies.
Enterprise Fix: Bot-led voice/chat screens with calibrated questions; automated scorecards mapped to the rubric; human-in-the-loop checkpoints for exceptions.
Evidence: Immutable transcripts; rubric IDs; question‑response pairs; calibration sessions; variance reports by interviewer and competency.
3) Equity blind spots: Adverse Impact by stage
KPI & Formula: Adverse Impact Ratio (AIR) = selection rate of group A ÷ selection rate of the highest‑rate group. Track at screen‑in, interview invite, offer, hire.
AI Benchmark: Maintain AIR ≥ 0.90 at each stage (with statistical tests for large N); auto‑trigger remediation below 0.80 (four-fifths guideline).
Enterprise Fix: Stage-level fairness monitors with alerts; explainable recommendations to show job-related features; structured interviews and consistent pass thresholds.
Evidence: Stage counts by group (where lawful), thresholds with justifications, bias mitigations logged and time-stamped.
4) Offer friction: Cycle time and fall-through
KPI & Formula: Offer Cycle Time = date(accepted) − date(offer generated); Offer Acceptance Rate (OAR) = accepted ÷ total offers.
AI Benchmark: Offer cycle <= 5 days median; OAR ≥ 80% for permanent roles; drop‑off analytics by reason code.
Enterprise Fix: Template-driven offers with auto-filled terms; triggered approver routing; nudges to hiring managers and candidates; compensation ranges validated against market data; pre-offer “readiness checklist.”
Evidence: E-signature logs; approver timestamps; message SLAs; compensation variance to range midpoint.
5) Underused goldmine: Rediscovery and talent pools
KPI & Formula: Rediscovery Contribution = % of hires from prior pipeline/CRM within last 24 months; Source Quality Yield = qualified slate rate/interviews/offers per source.
AI Benchmark: >= 25% of hires from rediscovery for high‑volume roles; Top‑3 sources account for >= 70% of qualified slates.
Enterprise Fix: Skills‑first search across historical applicants; auto‑refresh profiles via public signals and candidate opt-ins; nurture sequences; dedupe/identity resolution across ATS/VMS/HRIS.
Evidence: Source attribution with identity graph IDs; nurture engagement logs; stale‑profile refresh cadence.
6) Forecast credibility: Requisition SLA reliability
KPI & Formula: Req SLA Hit Rate = % of roles where each stage met SLA (JD→slate, slate→interview, interview→offer).
AI Benchmark: ≥ 85% overall; worst‑stage breach < 10% of reqs.
Enterprise Fix: Automated stage clocks; bottleneck diagnostics by role, location, and hiring manager; playbooks (e.g., widen skill adjacency, add panelists, accelerate comp approvals) triggered by breach prediction.
Evidence: Stage transition logs; breach alerts; playbook execution notes; time‑series trend by business unit.
Bottom line: These benchmarks compress time, raise quality, reduce risk, and cut spend – while creating a continuous evidence trail Finance and Audit can sample at will.
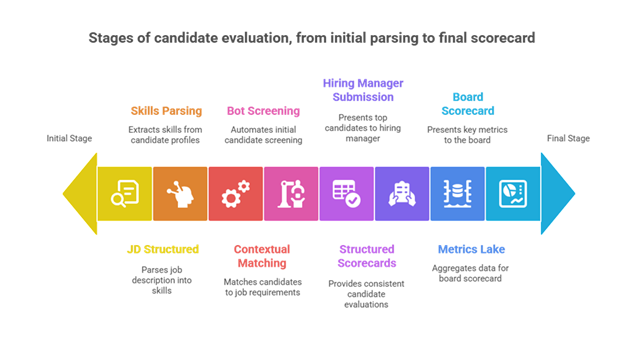
An AI‑native architecture that makes the metrics real
1) Unified data fabric. An intelligence layer reads/writes across ATS/VMS/HRIS and comms channels, normalizes stage definitions, resolves identities, and captures every transition once.
2) Structured signals at scale. Bot-led voice/chat screenings ask calibrated questions, capture verbatims, and score against job-related rubrics – creating consistent inputs for downstream analytics.
3) Contextual matching. Skills-first parsing and vector matching produce explainable shortlists; feature-level rationales show why a candidate fits.
4) Live governance. Fairness monitors (AIR by stage), model‑health dashboards (precision, drift, freshness), and immutable audit logs run alongside process KPIs.
5) Board-ready scorecard. Velocity, quality, equity, experience, cost, and model health roll up to CFO/CRO‑friendly tiles with click-through into the audit trail.Think of this as moving from quarterly snapshots to continuous, auditable hiring telemetry.
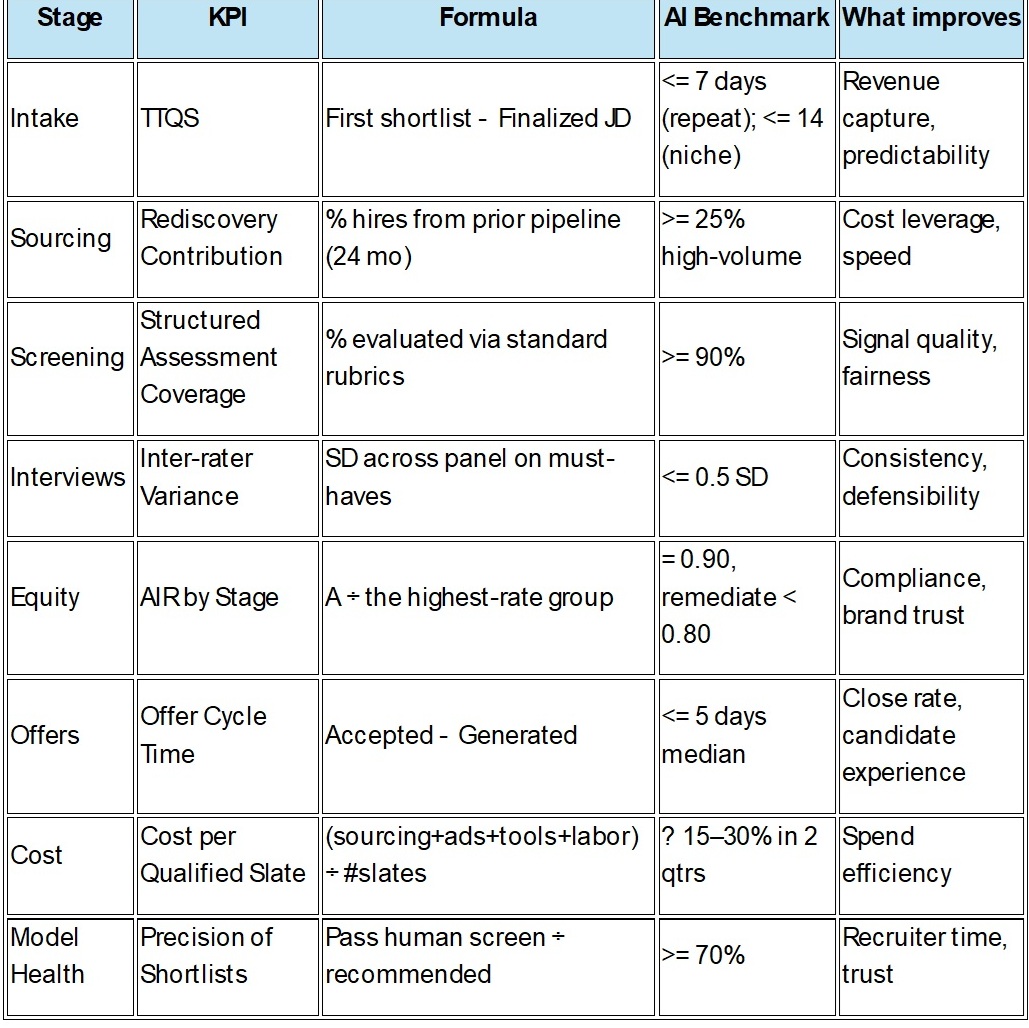
AI benchmarks by funnel stage (cheat sheet)
Use this as a planning table in your operating review. Values reflect achievable targets for large, multi-geo enterprises with an AI-first process; dial per role seniority and scarcity.
 Field story (anonymized)
A multi-region technology services company needed to fill 350 roles in 90 days without slipping on fairness reporting. Manual notes and inconsistent stage definitions made weekly forecasts unreliable. An AI-first pipeline delivered:
-
TTQS down 58% through structured JDs, skills parsing, and contextual matching.
-
Offer cycle time down 34% via auto-routed approvals and nudge sequences.
-
AIR ≥ 0.90 at every stage, with remediation playbooks auto-triggered on drift.
-
Cost per qualified slate down 22%, driven by rediscovery and automation savings.
-
A single-page Board Scorecard with audit log links satisfied Internal Audit and the Audit Committee chair.
Takeaway: When evidence is captured automatically, speed and fairness improve together.
For leaders: framing the value in three lines
-
Speed → Revenue capture. Predictable TTQS and tighter offer cycles bring projects forward and reduce contractor premiums.
-
Quality → Delivery reliability. Day‑90/180 ramp and 12-month retention stabilize run‑rate productivity.
-
Risk → Fewer surprises. Continuous AIR monitoring, explainable recommendations, and standards mapping reduce regulatory and reputational risk.
90-day implementation plan
Weeks 1–2: Define & connect
-
Agree KPI formulas and SLAs; map to ISO 30414 / ESRS S1 / GRI where applicable.
-
Switch on identity resolution across ATS/VMS/HRIS; freeze stage definitions.
-
Stand up a minimum viable scorecard: TTQS, Offer Cycle Time, AIR by stage, Candidate NPS, Cost per Qualified Slate.
Weeks 3–6: Structure & scale
-
Deploy structured JD templates and a governed skills taxonomy.
-
Enable bot-led standardized screenings with calibrated rubrics and transcripts.
-
Activate fairness monitors: AIR by stage with alerts and remediation playbooks.
Weeks 7–12: Govern & prove
-
Roll out the Board Scorecard with drill-through audit logs.
-
Pair Model Health with process KPIs (precision, drift, freshness).
-
Hold a joint HR–Finance cadence to connect hiring metrics to business outcomes.
Subtle but essential: the Eximius layer
Eximius serves as the system of intelligence on top of your ATS/VMS/HRIS, enabling:
-
Up to 90% faster sourcing through skills-first, contextual matching.
-
Up to 85% less screening effort via consistent voice/chat interviews and scorecards.
-
Up to 5× higher first shortlist quality by matching on demonstrated skills and outcomes.
-
Up to 60% faster time to hire and ~40% lower costs through automation, rediscovery, and board-ready analytics.
Because Eximius captures every signal – from JD versions to bot Q&A to manager decisions – your metrics come with built-in evidence and explainability, not estimates.
Conclusion (and next step)
The most expensive problems in hiring are rarely the obvious ones. They’re the silent gaps – unstructured inputs, noisy signals, fairness blind spots, and missing audit trails – that slow growth and invite risk. AI‑native benchmarks give your teams something better than a target: a continuous proof of performance. Close the gaps, raise the bar, and show your board a hiring engine that’s fast, fair, and verifiably effective.
Ready to operationalize these benchmarks? Let’s map your current funnel to the targets above and establish an evidence-first scorecard within 90 days. Talk to Eximius.